Liquid Gap Filler vs. Gap Pad: What the Compression Curves Don’t Show You
Compression curves tell part of the story. They don’t tell you what happens to contact area, stress distribution, or surface conformality at real assembly pressures. Here’s the fuller picture.
The Most Important Difference Isn’t on Any Compression Curve
It’s contact area at real surface topography. A liquid gap filler that achieves 95% contact area at a given BLT will outperform a gap pad that achieves 70% contact — regardless of what the bulk TC numbers say. Compression curves are measured on flat rigid fixtures. Real electronics assemblies are not flat.
What Compression Curves Measure — and What They Don’t
A gap pad compression curve (stress vs. strain, or thickness vs. applied pressure) tells you how the material deforms mechanically. Engineers use it to estimate BLT at a given clamp force and compressive load on the component beneath. These are useful data points — but they come from a test condition that matches almost no real electronics application.
The test condition mismatch: Compression curves are measured on flat, rigid fixtures. Real substrates have surface roughness (Ra 0.5–5 µm on machined aluminum heatsinks), component-to-component height waviness across a PCB, and feature topology from solder bumps, via heads, and component lead-outs. The curve tells you nothing about how the material behaves across these conditions.
The Conformality Gap Between Gap Pads and Liquid Gap Fillers
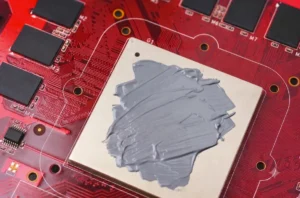
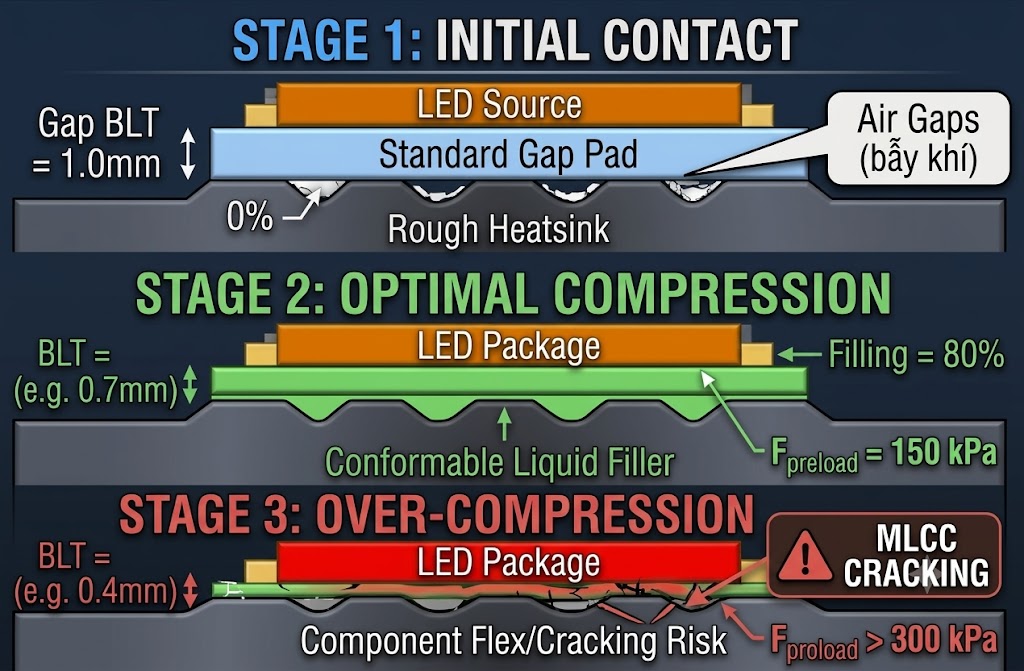
Gap pads are manufactured as flat sheets. Their conformality to irregular surfaces is limited by their stiffness — higher-TC gap pads tend to be harder, which means worse conformality to real surface features. This creates a fundamental problem at any surface that isn’t perfectly flat.
Gap Pad Over a 50 µm Feature — Two Bad Options
Option A: Bridges the feature, leaving an air void underneath — invisible in assembly, but devastating for local thermal resistance (air TC: 0.026 W/mK)
Option B: Deforms to contact — requires significant compression force that loads the component and surrounding substrate
Liquid Gap Filler — Wetting, Not Compression
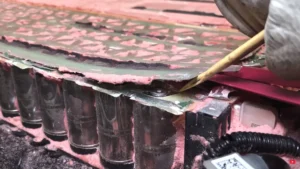
Flows into surface features before cure, making contact with the actual surface geometry rather than an idealized flat plane. Contact is governed by surface energy and capillary flow — not mechanical stiffness. Wettability on aluminum, copper, and PCB substrates is inherently superior to solid pads
Contact Area = Lower TR Floor
At identical average BLT, a liquid gap filler achieves higher effective contact area. Higher contact area means lower contact resistance. The TR you calculate from bulk TC and BLT is the floor — actual TR with a liquid gap filler is often lower because contact resistance is minimized
Air Voids Are Invisible Until Testing
A gap pad bridging a surface feature leaves an air void that is invisible to visual inspection at assembly. The thermal resistance impact only appears during thermal testing — or worse, during field failures when junction temperatures are higher than the thermal model predicted
Compression Stress and What It Means for Fragile Components
Compression curves also reveal the stress gap pads apply to the components beneath them. For standard gap pads at 1 mm assembled thickness, compressive stress is typically 50–200 kPa depending on hardness — transmitted directly to whatever is underneath.
MLCC Ceramic Capacitors
Sensitive to flexural stress — cracking under sustained compressive load is a known failure mode, particularly for smaller case sizes (0402, 0201). Gap pad compression force on a PCB can be sufficient to initiate cracking that propagates over thermal cycling
BGA Solder Joints
Experience shear stress when a pad applies non-uniform compression across a component footprint. Stress concentration at the pad-component boundary under repeated thermal cycling is a fatigue failure mechanism
Cumulative Stress Over Thermal Cycles
Stress accumulates over thermal cycles as the gap pad repeatedly compresses and relaxes. Each cycle applies and removes load — fatigue damage that does not manifest immediately but reduces reliability over the product lifetime
Liquid Gap Filler — Near-Zero Compression Stress
The material fills the gap under gravity and minor assembly closure force. The cured elastomer remains compliant (Type E hardness 10–50 depending on grade) — no preloaded compression force, no fatigue cycling on components, accommodation of relative motion through elastic deformation
The Automation Factor the Compression Curves Can’t Capture
Compression curves compare material mechanical behavior. They say nothing about the manufacturing process required to apply each material — and for complex assemblies at production volume, this difference is as significant as the thermal performance difference.
| Process Step | Gap Pad | Liquid Gap Filler |
|---|---|---|
| Geometry preparation | Die-cutting to shape — unique SKU per geometry | Dispense to any geometry — no die-cutting Simpler |
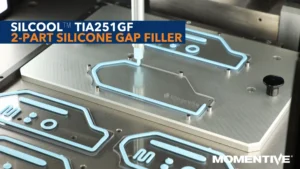
| Application method | Manual placement or pick-and-place | Robot dispense in seconds Faster |
| Positioning tolerance | Must be precisely placed — shift before closure causes void | Self-levels to fill gap — no placement precision required More robust |
| Complex 3D topography | Requires multiple pad thicknesses and shapes | Single dispense pass — conforms to all component heights One pass |
| Inventory management | Die-cut SKU per geometry × TC grade × thickness | One product SKU handles all geometries Lower inventory |
| Yield loss source | Pad shift, mis-placement, pad damage during handling | Mix ratio, pot life — addressable by process control |
| Assembly after TIM application | Immediate — no cure required | Pot life window (1–3 hrs) or pre-cured grade (unlimited) Pre-cured option |
When Gap Pads Are Actually the Better Choice
This is not a one-sided argument. Gap pads have genuine advantages in specific production contexts — and specifying liquid gap filler where pads are the better fit adds unnecessary process complexity.
Frequently Asked Questions
At equivalent average BLT, a liquid gap filler typically delivers lower thermal resistance than a gap pad — even if the gap pad has higher bulk TC. The reason is contact area: liquid gap fillers wet and conform to real surface topography, achieving contact across the entire interface. Gap pads bridge surface features, leaving air voids that add contact resistance. A liquid filler at 95% contact area outperforms a gap pad at 70% contact regardless of bulk TC values.
Gap pads are flat sheets with finite stiffness. When placed over real surface features — solder bumps, via heads, component leads, or surface waviness — the pad either bridges the feature (leaving an air void underneath, invisible to visual inspection) or deforms to contact (requiring significant compression force on the component). Higher-TC gap pads tend to be harder, making this worse. Air voids have TC of 0.026 W/mK — powerful local thermal insulators that only appear as unexpectedly high thermal resistance during testing.
Standard gap pads at 1 mm assembled thickness apply 50–200 kPa compressive stress to components beneath them. MLCC ceramic capacitors — particularly 0402 and 0201 case sizes — are sensitive to flexural stress. Cracking under sustained compressive load is a known failure mode. This stress also accumulates over thermal cycles as the pad repeatedly loads and unloads, creating fatigue damage that doesn’t cause immediate failure but degrades reliability over the product lifetime. Liquid gap fillers apply near-zero compression stress — the cured elastomer accommodates motion through elastic deformation rather than generating restoring force.
Total thermal resistance = bulk resistance (BLT/TC) + contact resistance (from incomplete surface wetting). A material achieving 95% contact minimizes contact resistance, making bulk TC the primary remaining variable. A material at 70% contact has significant air void resistance added to bulk resistance — regardless of TC. In practice, a liquid gap filler with lower TC but 95% contact often delivers lower total TR than a gap pad with higher TC but 70% contact on real surface topography. The compression curve comparison doesn’t capture this.
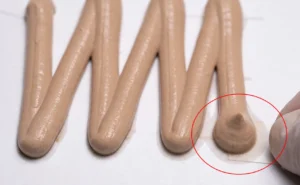
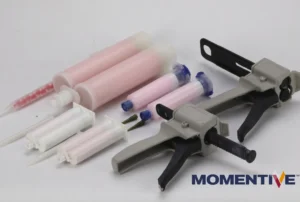
Liquid gap fillers are dispensed by robot in seconds onto any geometry — no die-cutting, no precise positioning, no shift verification before closure. Gap pads require die-cutting to shape (unique SKU per geometry), manual or pick-and-place handling, and precise placement. For complex 3D topographies with components at different heights, a gap pad requires multiple thicknesses and shapes — a gap filler is a single dispense pass. Inventory scales with every unique geometry for pads; one product SKU handles all geometries for liquid gap filler.
Gap pads make sense when: the interface gap is large (>2 mm) and uniform; the production line cannot accommodate dispensing equipment and a cure step; the interface geometry is genuinely flat and the conformality advantage is minimal; or immediate handling after TIM application is required. For complex surface topographies, variable gaps, stress-sensitive components, or lines already running automated dispensing — liquid gap filler will typically outperform gap pads in both thermal performance and process reliability.
The Right Question to Ask When Comparing
Don’t ask: which material has higher TC? Ask: which material achieves higher contact area on my actual surface topography at my actual assembly pressure? The material that answers that question with a higher number will deliver lower total thermal resistance — regardless of what the compression curves and bulk TC values look like on paper.
Need Contact Resistance and Conformality Data for Your Interface?
Request full technical data sheets — including TR vs. BLT curves measured at real surface roughness conditions, contact resistance data, and compression stress values for your specific assembly geometry and clamp force.