Thermal Conductivity vs. Thermal Resistance — Engineers Confuse These More Than You’d Expect
Every thermal interface material datasheet lists both thermal conductivity (W/mK) and thermal resistance (mm²K/W). They’re related, but they measure different things — and optimizing for the wrong one leads to poor design decisions.
The Core Insight in One Sentence
TC is a material property. TR is what your design actually experiences. Always evaluate TIMs on thermal resistance at your real operating BLT — not on the TC headline from the spec sheet. A lower-TC material at a thinner bondline will outperform a higher-TC material at a thicker bondline every time.
The Definitions — Without the Hand-Waving
Thermal conductivity and thermal resistance are related but fundamentally different quantities. Confusing them — or treating TC as a proxy for TR — is the most common error in TIM datasheet comparison.
Symbol λ or k. Tells you how well a given material conducts heat — independent of geometry. Measured in W/mK. A higher number means better bulk conduction. This is what the headline number on every TIM datasheet reports.
Material property
Geometry-independent
Easy to compare
Symbol R or θ. Tells you how much a specific interface — with a specific material, at a specific thickness, over a specific area — resists heat flow. This is what your design actually experiences at the component-to-heatsink boundary.
System property
Geometry-dependent
What matters in practice
The Formula Connecting Them
TR = BLT ÷ TC × 1000
Where BLT is the bondline thickness in mm — the actual compressed thickness of the material in your assembly. This is not the pad thickness from the datasheet. It is the thickness after assembly closure under your specific clamp force.
BLT (mm)
Bond line thickness — determined by your assembly geometry, gap tolerance, component height variation, and clamp force. Not the material’s nominal thickness
TC (W/mK)
Thermal conductivity of the material. From the datasheet — but verify it was measured at a representative thickness, not a thick bulk sample far from your operating BLT
Critical Implication
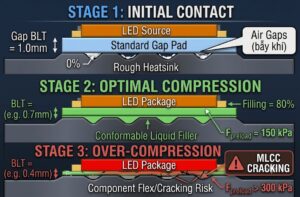
A lower-TC material that achieves a significantly thinner BLT can deliver lower thermal resistance than a higher-TC material at a thicker BLT. BLT matters more than TC in thin-bondline applications
The Calculation That Surprises Most Engineers
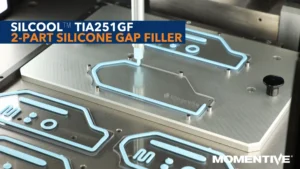
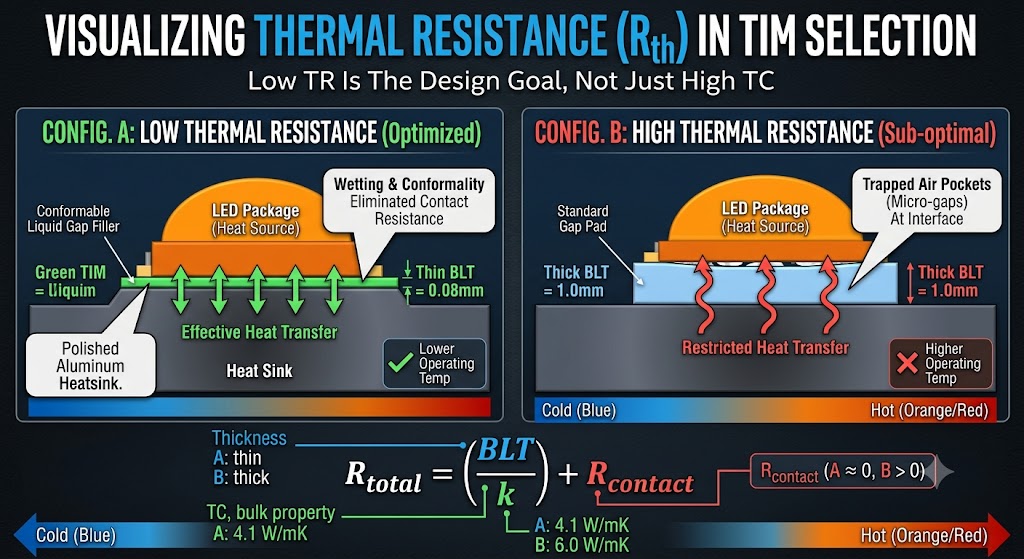
Compare a standard gap pad with a liquid gap filler. The higher-TC material loses — decisively — because bondline thickness has a larger impact on thermal resistance than TC does at typical interface thicknesses.
| Material | TC (W/mK) | BLT (mm) | TR (mm²K/W) |
|---|---|---|---|
| Gap pad (standard 1 mm) | 6.0 +46% higher TC | 1.0 | 167 |
| Liquid gap filler (TIA241GF) | 4.1 | 0.08 | 20 88% lower TR |
The gap pad has 46% higher thermal conductivity. The liquid gap filler delivers 88% lower thermal resistance. The gap filler wins decisively — because BLT matters more than TC in this thickness regime. This is counterintuitive to engineers who optimize for TC first, but the math is unambiguous.
Why Thermal Conductivity Alone Is a Misleading Metric for TIM Selection
TC is a bulk material property measured on a thick sample under controlled lab conditions. In actual electronics assemblies, the interface is thin and contact resistance at the material-substrate boundary can dominate total thermal resistance — completely independently of the material’s bulk TC.
Contact Resistance Is Real
No matter how flat heatsink and component surfaces look, they’re both rough at the micron scale. Air gaps that fill those asperities (air TC: 0.026 W/mK) are powerful thermal insulators — and they add resistance that has nothing to do with the TIM’s bulk TC
Wettability Is a Thermal Parameter
A material that wets and conforms to surface topography eliminates air pockets from the interface. A rigid material — like a stiff gap pad — under insufficient compression leaves air pockets that can dwarf the bulk resistance of the pad itself
TC Is Measured on Thick Samples
ASTM D5470, Hot Disk, and Laser Flash methods measure TC on thick samples (often 2 mm+) under controlled conditions. In assemblies with 0.08–0.3 mm BLT, the actual effective TC at that thickness may differ from the bulk value
TR Includes Both Effects
Thermal resistance (TR) captures both bulk conduction resistance (BLT/TC) and contact resistance at both interfaces — giving a complete picture of actual assembly performance that TC alone cannot provide
How to Read a TR vs. BLT Curve Correctly
High-quality TIM datasheets include a TR vs. thickness plot. This is the most useful data in the sheet — more useful than the headline TC number. Most engineers read only the headline TC and miss the critical information in this curve.
Y-Intercept — Pure Contact Resistance
Total TR as BLT → 0. This represents pure contact resistance — the interface quality at zero material thickness. Lower is better and indicates better surface wetting and conformality. A material with low y-intercept outperforms at thin bondlines regardless of its bulk TC
Slope — Inverse of TC
The slope of TR vs. BLT equals 1/TC. A steeper slope means lower TC. The slope should be consistent with the claimed TC value — if it isn’t, the test method or sample geometry is suspect. Verify consistency before accepting the TC headline
Reported BLT — Verify It Matches Your Assembly
Many datasheets report TC at bulk sample thickness (e.g., 2 mm) and TR at a different BLT (e.g., 80 µm). These are two different measurements at different thicknesses. Verify that the TR value is reported at the BLT your design will actually achieve — not at an arbitrary test condition
Compression Force Used — Must Match Your Assembly
TR values are always compression-force dependent for compliant materials. Verify the reported TR was measured at a compression force representative of your assembly clamp load — not a standardized lab pressure that doesn’t match your design
How to Correctly Evaluate TIMs for Your Design
Four steps — run these in order for every TIM comparison. Shortcutting to TC comparison skips the three steps that actually determine which material performs better in your assembly.
TIM Evaluation Workflow — 4 Steps in Order
① Calculate Your BLT
Determine the BLT your assembly will achieve — based on your gap tolerance, component height variation, and clamp force. This is not the material’s nominal thickness — it is the compressed thickness in your specific assembly
② Calculate TR = BLT ÷ TC
For each candidate material, calculate: TR (mm²K/W) = BLT (mm) / TC (W/mK) × 1000. Use your BLT from Step 1 — not the datasheet’s test BLT unless they match your assembly conditions
③ Add Contact Resistance
From the TR vs. BLT curve, read the y-intercept (contact resistance at BLT = 0). Add this to the bulk resistance from Step 2 to get total interface resistance. Ignore this step and you will underestimate TR for rigid materials
④ Compare Total TR — Not TC
Select the candidate with lowest total TR at your operating BLT. A material with TC of 4 W/mK at 80 µm BLT will outperform a material with TC of 8 W/mK at 500 µm BLT in almost every thin-bondline application
Frequently Asked Questions
Thermal conductivity (TC, W/mK) is a material property — it measures how well the bulk material conducts heat, independent of geometry. Thermal resistance (TR, mm²K/W) is a system property — it measures how much a specific interface, at a specific thickness over a specific area, resists heat flow. The relationship is: TR = BLT / TC × 1000. TC is easy to compare across datasheets. TR is what your design actually experiences in service.
Yes — and this happens routinely. TIA241GF at 4.1 W/mK with 80 µm BLT gives TR ≈ 20 mm²K/W. A 6 W/mK gap pad at 1 mm BLT gives TR ≈ 167 mm²K/W. The gap filler delivers 88% lower thermal resistance despite 46% lower TC — because BLT dominates thermal resistance in thin-bondline applications. TC is easy to compare across datasheets; BLT requires knowing your assembly geometry. But the math doesn’t care about what’s easy to measure.
Contact resistance is the additional thermal resistance from microscopic surface roughness at the material-substrate interface. No matter how flat surfaces appear, they’re rough at the micron scale — air gaps filling those asperities act as thermal insulators (air TC: 0.026 W/mK). A material that wets and conforms to surface topography eliminates these air gaps and has low contact resistance. A rigid material under insufficient compression leaves air pockets that can dominate total thermal resistance independently of the material’s bulk TC.
Check four things: (1) Y-intercept — pure contact resistance as BLT → 0; lower means better surface wetting. (2) Slope — equals 1/TC; verify consistency with the headline TC value. (3) Reported BLT — verify the TR value was measured at the BLT your design achieves, not an arbitrary test thickness. (4) Compression force — TR is compression-dependent for compliant materials; verify test conditions match your assembly clamp load.
Use: TR (mm²K/W) = BLT (mm) ÷ TC (W/mK) × 1000. First determine the BLT your assembly will achieve based on gap tolerance, component height variation, and clamp force — this is not the material’s nominal thickness. Then add contact resistance from the y-intercept of the TR vs. BLT curve to get total interface resistance. Compare total TR across candidate materials at your actual operating BLT — not TC values from the headline.
Standard TC test methods (ASTM D5470, Hot Disk, Laser Flash) measure on thick samples — typically 2 mm or more — for reproducibility. In assemblies with BLT of 0.08–0.5 mm, the actual effective TC at that thickness may differ, and contact resistance effects (not captured in bulk TC measurement) dominate at thin bondlines. This is why TR measured at your actual assembly BLT is the more relevant specification — not the bulk TC from a 2 mm test coupon.
The Evaluation Checklist
① Calculate your actual BLT from assembly geometry and clamp force.
② Compute TR = BLT ÷ TC × 1000 for each candidate at that BLT.
③ Add contact resistance from the TR vs. BLT curve y-intercept.
④ Compare total TR — not TC. The material with the lowest total TR at your operating BLT is the better thermal solution, regardless of where it ranks on the TC headline.
Need TR vs. BLT Curve Data for Your Application?
Request full technical data sheets — including TR vs. BLT plots, contact resistance data, and compression force specifications for your specific interface geometry and assembly conditions.