Why Your Thermal Pad Is Costing You More Than You Think
Gap pads are the default TIM for many design teams because they’re familiar, easy to handle, and well-understood. They’re also accumulating hidden costs that rarely appear in the BOM comparison. Here’s how to see the full picture.
The BOM Cost vs. Total Cost Problem
When procurement compares thermal pad cost to liquid gap filler cost, they compare material cost per unit area. On that metric, gap pads often look competitive or cheaper. But BOM cost captures only one line in a longer cost equation — and the hidden costs of gap pads appear in manufacturing, quality, and design, where they are often larger than the material cost difference.
Four Hidden Costs of Thermal Gap Pads That Don’t Appear on the BOM
Each of the four costs below appears in a different part of the business — procurement, manufacturing, quality, and engineering. That fragmentation is why they’re invisible in a standard BOM comparison.
Cost 1 — Die-Cutting and Inventory Complexity
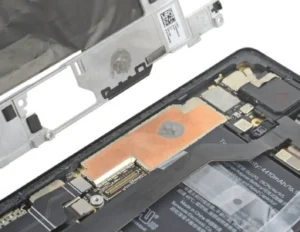
Gap pads arrive as rolls or sheets. Your specific interface geometry — shaped around connectors, irregular component outlines, chassis features — requires custom die-cutting. This generates a cascade of costs that compound across the product portfolio.
Tooling Cost
Per unique shape — amortized over production volume, but real for NPI and low-volume programs
SKU Proliferation
Every product variant with a different interface geometry needs its own pad SKU in inventory
MOQ and Stockout Risk
Minimum order quantities per SKU — leading to overstock or stockout risk when production mix shifts
Lead Time Exposure
When a pad geometry needs to change mid-production, new tooling and minimum order are required
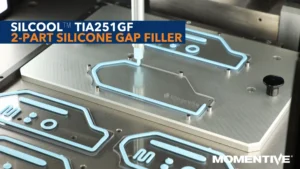
Liquid gap filler alternative: Dispensed to any geometry by programming the robot. No tooling, no SKU proliferation, no minimum order. Product geometry change = software update. One product SKU handles every interface geometry in the portfolio.
Cost 2 — Assembly Yield Loss
Gap pads require precise placement. A pad that shifts during assembly — either during placement or when the heatsink is lowered — creates voids or uneven contact. Three specific failure modes generate yield loss that is often untracked as a TIM cost.
Pad Misalignment
Pad doesn’t cover the target component, leaving it thermally unprotected. Invisible until thermal test — or field failure
Pad Folding
During heatsink closure, the pad edge folds under itself — creating a double-thickness ridge that prevents proper heatsink seating
Adhesive Contamination
PSA (pressure-sensitive adhesive) on one face for positioning — misplacement creates adhesive residue requiring solvent cleaning of bond pads or connectors
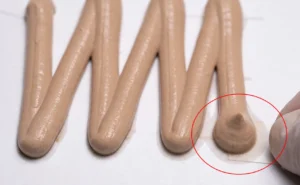
Liquid gap filler alternative: Dispensed to a fixed XY coordinate by robot. Placement error is a software parameter, not a human handling variable. First-pass yield for dispensed gap filler is consistently higher than for manual pad placement in comparable applications.
Cost 3 — Rework Cost
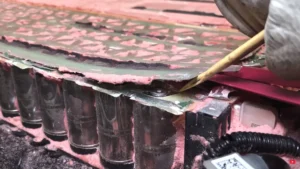
When a board fails thermal test or visual inspection and needs rework, the TIM must be removed and reapplied. The rework process is fundamentally different between gap pads and liquid gap filler.
Cost 4 — Thermal Margin Cost (The Hardest to See)
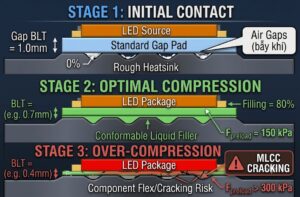
This is the hardest cost to see but potentially the most significant over product lifetime. If your thermal pad isn’t achieving full contact area, you’re leaving thermal resistance on the table — and paying for it in system-level compensations.
Power Derating
Operating at lower power than the component rating allows — leaving performance on the table to protect junction temperature
Additional Heat Spreading
Copper or vapor chambers added between component and TIM to compensate for inadequate interface thermal resistance
Larger Heatsink or Fan
System cost, volume, and weight added to handle the thermal resistance that the TIM should have addressed at the interface
Shortened Component Lifetime
Junction temperature directly drives MTTF via Arrhenius — every degree over target accelerates degradation and reduces service life
If a liquid gap filler at 80 µm BLT saves 0.5°C junction temperature vs. a 1 mm gap pad, and that 0.5°C enables 3% more power without derating, the value of that 3% headroom in an EV motor controller or 5G base station is not trivial at production scale.
Running the Real Cost Comparison — All Six Line Items
The correct cost comparison for gap pad vs. liquid gap filler includes six line items. Items 2–6 often exceed item 1 in total. This isn’t an argument that liquid gap filler always wins — it’s an argument that the comparison should include all six items, not just the first one.
| Cost Component | Gap Pad | Liquid Gap Filler |
|---|---|---|
| ① Material cost per unit | Lower per cm² BOM advantage | Higher — includes factory processing |
| ② Die-cutting tooling | Required — per unique geometry, amortized over program life | None — geometry is a software parameter Zero |
| ③ Inventory carrying cost | Per SKU × safety stock × number of geometries in portfolio | Single SKU for all geometries Minimal |
| ④ Assembly labor + yield loss | Manual placement labor + yield loss from misalignment and folding | Robotic dispense — higher first-pass yield Lower |
| ⑤ Rework rate × rework cost | Solvent clean + new pad + labor; adhesive residue risk | Peel and redispense — no solvent, no adhesive residue Lower |
| ⑥ Thermal headroom value | Lower contact area → higher TR → power derating or larger heatsink | Higher contact area → lower TR → more power headroom Higher |
| Total cost of ownership | Lower material cost, higher on items 2–6 | Higher material cost, lower on items 2–6 — often lower TCO below ~500 units/day |
Challenge: Before your next TIM comparison, ask your manufacturing team for the actual yield loss rate on pad placement and the average rework time per board. Those numbers, put against gap filler process costs, usually tell a different story than the BOM comparison alone.
Frequently Asked Questions
Gap pad BOM cost captures only material cost per unit area. Hidden costs include: die-cutting tooling amortized over program life; inventory carrying cost per SKU × number of unique geometries in the portfolio; assembly yield loss from pad misalignment, folding, and adhesive contamination; rework cost including solvent cleaning; and thermal margin cost when incomplete contact area forces power derating or larger heatsink. Items 2–5 often exceed the material cost difference compared to liquid gap filler.
Gap pad rework: remove heatsink, peel off pad (risks component damage if adhered), solvent clean PSA adhesive residue from bond pads and connectors, apply new pad with precise positioning. Liquid gap filler rework: peel the cured silicone elastomer cleanly from metal and PCB surfaces — no adhesive residue, no solvent required, then run the standard dispense operation. The reworkability of addition-cure silicone gap fillers is a designed-in material property.
Every unique interface geometry requires a separate die-cut pad SKU — unique tooling, minimum order quantity, and inventory management for each shape. When production mix shifts, some SKUs go into overstock while others stockout. When a geometry changes, new tooling and a new minimum order are required. A liquid gap filler has no geometry dependency — one product SKU is dispensed to any geometry by robot programming. Geometry change = software update, no inventory adjustment.
Incomplete pad contact area forces compensating measures: power derating to protect junction temperature; additional heat spreading layers (copper, vapor chambers); larger heatsinks or higher fan speeds; or accepting shorter component lifetime from elevated junction temperature. In EV motor controllers and 5G base stations, even 0.5°C junction temperature reduction from better TIM contact enables 3% more power headroom or extends product lifetime — with direct commercial value at production scale.
Not always — the answer depends on production volume, portfolio geometry complexity, and rework rates. Gap pads have lower material cost per unit area. Liquid gap fillers have lower tooling cost, zero SKU proliferation, lower assembly yield loss, and lower rework cost. For volumes below ~500 units/day or portfolios with multiple geometries, total TCO for liquid gap filler is typically lower despite the higher material cost. The comparison must include all six cost components — not just BOM material cost.
Three specific failure modes: pad misalignment — pad doesn’t cover the target component; pad folding — pad edge folds under itself during heatsink closure, creating a double-thickness ridge that prevents proper heatsink seating; adhesive contamination — PSA residue on bond pads or connectors when repositioning is required. Liquid gap filler is dispensed to a fixed robot coordinate — placement error is a software parameter, not a human handling variable, resulting in consistently higher first-pass yield.
The Right Comparison Framework
Before your next TIM comparison, ask your manufacturing team for the actual yield loss rate on pad placement and the average rework time per board. Those numbers, put against gap filler process costs across all six cost components, usually tell a very different story than the BOM comparison alone.
Want to Run the Total Cost Comparison for Your Application?
Our technical team can help you build a complete cost comparison — including material cost, tooling amortization, yield loss differential, and thermal headroom value — for your specific production volume and interface geometry.